We’ve all heard that a picture is worth a thousand words—but so is a map. When you look up your home address on Google Maps, you’ll learn things about your neighborhood that aren’t readily apparent from walking its streets. Compare a current day map of your community to one produced 50 years ago and you’ll take a trip through history that yields different perspectives on the present. View the same map of your city at different scales and resolutions and you’ll discover your community from a whole new angle.
Lawrence Hoffman, Groundwork Milwaukee’s GIS (Geographic Information Systems) Program Manager, knows first-hand the potential maps hold to advance the work of Groundwork communities. “Generally speaking, Groundwork’s mission is inherently spatial. Revitalizing vacant lots—that’s something we do a lot of in Milwaukee. We work with residents to identify and transform vacant spaces and assist in building community around these transformations. Maps track the spatial component of all that. They let you identify where to work and help tell your story after the fact. For instance, there are over 110 community gardens in the Groundwork Milwaukee garden network, which we call ‘Milwaukee Grows.’ It’s one thing to cite the number, but when you show someone a map of the network, it’s much more impressive. People say things like, ‘Wow. I had no idea. You guys are on every block in the city!'”
Through its GIS program, Groundwork Milwaukee leverages Hoffmann’s cartographic expertise to enhance a variety of projects, from creating inventories of the city’s raised garden beds and Milwaukee County’s orchards to conducting commercial surveys with an eye toward stimulating economic activity in Milwaukee’s business improvement districts to working with Groundwork Milwaukee’s Green Team to tell the visual, map-based story of their 2018 service corps trip to Grand Teton National Park with Groundwork USA. When Groundwork Milwaukee established its GIS program in 2017, one of its goals was to provide mapping and GIS technical capacity to the broader Groundwork USA Network. These days, Hoffmann is supporting Groundwork USA’s Climate Safe Neighborhoods (CSN) project, helping staff from five Groundwork Trusts harness the power of maps to shed light on their communities’ past and present and draft a new story of climate resiliency for their future.
CSN Project Director Cate Mingoya has written previously about how federal agencies created so-called “redlining” maps to determine eligibility for home loans, effectively barring the gates to homeownership and the financial security and wealth-building that it provides to communities of color across the United States:
“In 1935, the Federal Home Loan Bank Board authorized the creation of ‘residential security maps’ to indicate the desirability of real estate holdings in 239 cities across the United States. Used in conjunction with the Federal Housing Administration’s underwriting manual, these maps were used to decide who got home loans and who didn’t. Wealthy, white neighborhoods on the edges of cities were outlined in green and marked as safe bets for mortgage lending. Those dense neighborhoods outlined in red (or “redlined”)—often communities with majority black or brown residents—were considered too risky for loans.”
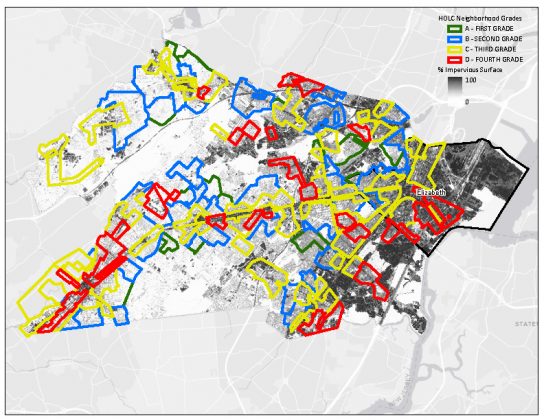
Historic HOLC “redlining” map superimposed over the current-day impervious surface map of Elizabeth, New Jersey. The red- and yellow-outlined areas—considered too risky for home loans—align with the heavily paved areas. NOTE: The HOLC only drew lines around residential areas, so many of the most heavily paved areas are not within HOLC boundaries, as they are commercial or industrial rather than residential.
Layering these historic redlining maps with contemporary maps of impervious surface and tree canopy coverage and poverty rates in the CSN project communities, Hoffman and the project coordinators from Groundwork Denver, Groundwork Elizabeth (NJ), Groundwork Rhode Island, Groundwork Richmond (CA), and Groundwork RVA (Richmond, VA) are exploring the relationship between the legacy of institutional racism and the present and anticipated consequences of extreme heat and flooding. Their ultimate goal: to identify the most vulnerable neighborhoods and mobilize local stakeholders to influence climate resilience policies, programming, and investments that can help mitigate and build resilience to those climate-induced risks. This multi-year, multi-Trust collaboration is supported, in part, by a grant from the Kresge Foundation.
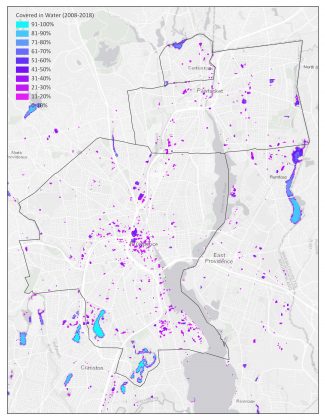
The CSN collaboration has been further aided by a first-of-its-kind partnership between Groundwork USA and NASA DEVELOP, a part of NASA’s Applied Sciences Program that employs NASA’s earth and climate resources to address interdisciplinary environmental and public policy issues. Working with NASA remote sensing data, NASA DEVELOP devised a rigorous methodology for evaluating land surface temperature and risk of flooding for two CSN participating cities, Elizabeth, New Jersey, and Providence, Rhode Island. The NASA team provided detailed operating procedures to Hoffman, which will allow him to replicate their methods for other cities as the project progresses. The NASA collaboration provides Groundwork access to NASA scientists and methods that enable Hoffman to more efficiently use the very large store of NASA satellite imagery, which, despite being publicly available, requires advanced technical skills to analyze and interpret. The technical expertise and training tools provided by NASA DEVELOP enable the CSN project team to conduct sophisticated GIS analyses of the risks and impacts of extreme heat and flooding.
Once the mapping analysis is completed, the Groundwork Trust coordinators in the CSN communities will use the information to better understand their communities and the relationship between historical housing segregation practices and the current risk of exposure to extreme heat and flooding. They will then use that knowledge to create a data-informed plan of action for building climate resilience in the neighborhoods most at risk.
“There’s a really long and intentional history of federally sanctioned, enforced segregation in this country,” says Mingoya. “And we are beginning to see evidence that those neighborhoods with a long history of segregation also have a history of disinvestment in green infrastructure, parks, green spaces, permeable pavement-things that could help mitigate the impacts of extreme heat and flooding.”
The end goal, she explains, is to amplify the voices and lived experiences of climate-vulnerable community residents to generate and advocate for resiliency measures that meet their needs.
“The fact that these specific neighborhoods are vulnerable to extreme heat and flooding is no accident, and they’re not going to change by accident. Residents know first-hand exactly what kind of change needs to happen, and they’re owed a safer future.”